Fraud Blocker Skip to main content

Graph Collection (page 7)

"Unveiling the Intricacies: A Journey through Graphs" Step into a world where art and science intertwine, as we explore the captivating realm of graphs

Background imageGraph Collection: Sample bar graph from the Business Graphics software package of an Apple II computer, c1983

Sample bar graph from the Business Graphics software package of an Apple II computer, c1983
BUSINESS SOFTWARE, c1983. Sample bar graph from the Business Graphics software package of an Apple II computer, c1983

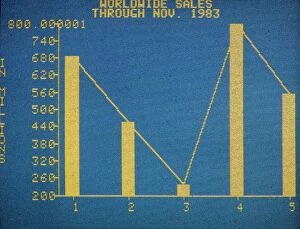
Background imageGraph Collection: Sample bar graph depicting a companys worldwide sales, displayed on an Apple II computer, c1983

Sample bar graph depicting a companys worldwide sales, displayed on an Apple II computer, c1983
BUSINESS SOFTWARE, c1983. Sample bar graph depicting a companys worldwide sales, displayed on an Apple II computer, c1983

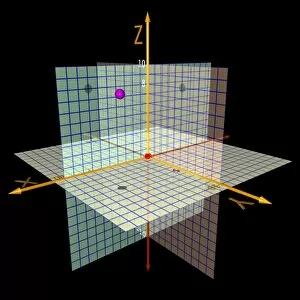
Background imageGraph Collection: Cartesian coordinates in 3 dimensions C017 / 6989

Cartesian coordinates in 3 dimensions C017 / 6989
Cartesian coordinates in three dimensions, computer artwork. At centre is the origin (red). This lies at point 0, 0, 0, where the X Y and Z axes meet

Background imageGraph Collection: Cartesian coordinates in 3 dimensions C017 / 6998

Cartesian coordinates in 3 dimensions C017 / 6998
Cartesian coordinates in three dimensions, computer artwork. At centre is the origin (red). This lies at point 0, 0, 0, where the X Y and Z axes meet

Background imageGraph Collection: Cartesian coordinates in 3 dimensions C017 / 6999

Cartesian coordinates in 3 dimensions C017 / 6999
Cartesian coordinates in three dimensions, computer artwork. At centre is the origin (red). This lies at point 0, 0, 0, where the X Y and Z axes meet

Background imageGraph Collection: Pie chart, artwork F006 / 7123

Pie chart, artwork F006 / 7123
Pie chart, computer artwork

Background imageGraph Collection: Pie chart, artwork F006 / 7098

Pie chart, artwork F006 / 7098
Pie chart, computer artwork

Background imageGraph Collection: Pie chart, artwork F006 / 7097

Pie chart, artwork F006 / 7097
Pie chart, computer artwork

Background imageGraph Collection: ECG, artwork F006 / 4606

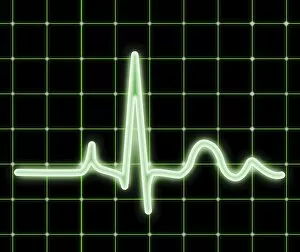
ECG, artwork F006 / 4606
ECG. Computer artwork of an electrocardiogram (ECG) showing a normal heart rate

Background imageGraph Collection: Maze, artwork F006 / 7142

Maze, artwork F006 / 7142
Maze, computer artwork

Background imageGraph Collection: Disease statistics F008 / 2930

Disease statistics F008 / 2930
Disease statistics

Background imageGraph Collection: Lissajous figure, artwork F005 / 2992

Lissajous figure, artwork F005 / 2992
Computer artwork of a Lissajous figure or Bowditch curve, which is the graph of a system of parametric equations which describe complex harmonic motion

Background imageGraph Collection: Lissajous figure, artwork F005 / 2986

Lissajous figure, artwork F005 / 2986
Computer artwork of a Lissajous figure or Bowditch curve, which is the graph of a system of parametric equations which describe complex harmonic motion

Background imageGraph Collection: Lissajous figure, artwork F005 / 2994

Lissajous figure, artwork F005 / 2994
Computer artwork of a Lissajous figure or Bowditch curve, which is the graph of a system of parametric equations which describe complex harmonic motion

Background imageGraph Collection: Lissajous figure, artwork F005 / 2988

Lissajous figure, artwork F005 / 2988
Computer artwork of a Lissajous figure or Bowditch curve, which is the graph of a system of parametric equations which describe complex harmonic motion

Background imageGraph Collection: Lissajous figure, artwork F005 / 2985

Lissajous figure, artwork F005 / 2985
Computer artwork of a Lissajous figure or Bowditch curve, which is the graph of a system of parametric equations which describe complex harmonic motion

Background imageGraph Collection: Lissajous figure, artwork F005 / 2989

Lissajous figure, artwork F005 / 2989
Computer artwork of a Lissajous figure or Bowditch curve, which is the graph of a system of parametric equations which describe complex harmonic motion

Background imageGraph Collection: Lissajous figure, artwork F005 / 2991

Lissajous figure, artwork F005 / 2991
Computer artwork of a Lissajous figure or Bowditch curve, which is the graph of a system of parametric equations which describe complex harmonic motion

Background imageGraph Collection: Lissajous figure, artwork F005 / 2993

Lissajous figure, artwork F005 / 2993
Computer artwork of a Lissajous figure or Bowditch curve, which is the graph of a system of parametric equations which describe complex harmonic motion

Background imageGraph Collection: Lissajous figure, artwork F005 / 2990

Lissajous figure, artwork F005 / 2990
Computer artwork of a Lissajous figure or Bowditch curve, which is the graph of a system of parametric equations which describe complex harmonic motion

Background imageGraph Collection: Lissajous figure, artwork F005 / 2984

Lissajous figure, artwork F005 / 2984
Computer artwork of a Lissajous figure or Bowditch curve, which is the graph of a system of parametric equations which describe complex harmonic motion

Background imageGraph Collection: Heart beat, artwork

Heart beat, artwork
Heart beat, computer artwork

Background imageGraph Collection: Business projections, conceptual artwork F007 / 0254

Business projections, conceptual artwork F007 / 0254
Business projections, conceptual artwork

Background imageGraph Collection: Stock Market Indices, Figures and Prices C016 / 9198

Stock Market Indices, Figures and Prices C016 / 9198
Stock market indices, figures or prices. A stock market or equity market is a public entity (a loose network of economic transactions)

Background imageGraph Collection: Stock Market Indices, Figures and Prices C016 / 9192

Stock Market Indices, Figures and Prices C016 / 9192
Stock market indices, figures or prices. A stock market or equity market is a public entity (a loose network of economic transactions)

Background imageGraph Collection: Lewis-mckenzie polygraph, circa 1900 C017 / 6947

Lewis-mckenzie polygraph, circa 1900 C017 / 6947
Lewis-McKenzie polygraph, made in 1900 by Cambridge and Paul Instrument Co. This device was used to graphically record venous and arterial pulses simultaneously

Background imageGraph Collection: Cathode ray tube colour gamut C016 / 2058

Cathode ray tube colour gamut C016 / 2058
Cathode ray tube colour gamut. This graphic represents the range of colours produced by a cathode ray tube (CRT). The gamut (triangular) is typically less than the entire available colour space

Background imageGraph Collection: Bio-organic chemistry lab, France C017 / 7956

Bio-organic chemistry lab, France C017 / 7956
Bio-organic chemistry lab. Sample analysis results on a computer screen at the COBRA Bio-organic chemistry laboratory at the IRCOF (Fine Organic Chemistry Research Institute), University of Rouen

Background imageGraph Collection: Global stock markets, conceptual artwork

Global stock markets, conceptual artwork

Background imageGraph Collection: Penicillin research, World War II C016 / 4300

Penicillin research, World War II C016 / 4300
Penicillin research. Graph showing the rate of excretion of the antibiotic drug penicillin following intravenous administration. The horizontal axis shows time in hours
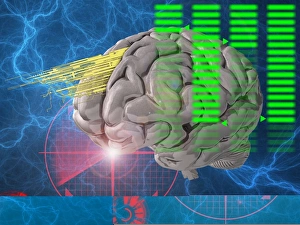
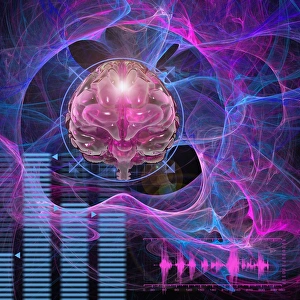
Background imageGraph Collection: Brain activity, conceptual artwork C013 / 9963

Brain activity, conceptual artwork C013 / 9963
Brain activity, conceptual computer artwork

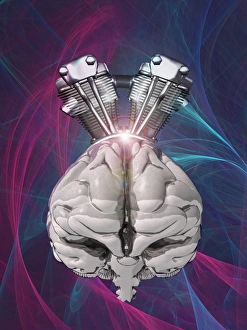
Background imageGraph Collection: Harnessing brain power, artwork C013 / 9965

Harnessing brain power, artwork C013 / 9965
Harnessing brain power, conceptual computer artwork

Background imageGraph Collection: Brain activity, conceptual artwork C013 / 9964

Brain activity, conceptual artwork C013 / 9964
Brain activity, conceptual computer artwork

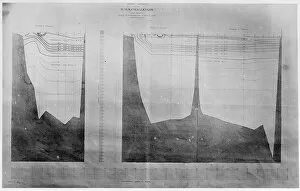
Background imageGraph Collection: Chart of oceanic section, Tenerife to Sombrero

Chart of oceanic section, Tenerife to Sombrero
A photograph taken during the voyage of H.M.S. Challenger (1872-1876) funded by the British Government for scientific purposes

Background imageGraph Collection: Chart of oceanic section, Bermuda to Azores

Chart of oceanic section, Bermuda to Azores
A photograph taken during the voyage of H.M.S. Challenger (1872-1876) funded by the British Government for scientific purposes

Background imageGraph Collection: Chart of oceanic section, to St. Pauls Rocks

Chart of oceanic section, to St. Pauls Rocks

Background imageGraph Collection: Chart of oceanic section, Tristan D Acunha to Cape of Good H

Chart of oceanic section, Tristan D Acunha to Cape of Good H
A photograph taken during the voyage of H.M.S. Challenger (1872-1876) funded by the British Government for scientific purposes

Background imageGraph Collection: Chart of oceanic section, Halifax, Bermuda

Chart of oceanic section, Halifax, Bermuda
A photograph taken during the voyage of H.M.S. Challenger (1872-1876) funded by the British Government for scientific purposes

Background imageGraph Collection: 37th President of the United States. Nixon giving a speech about the troop level in South Vietnam

37th President of the United States. Nixon giving a speech about the troop level in South Vietnam. Photograph, c1971
RICHARD NIXON (1913-1994). 37th President of the United States. Nixon giving a speech about the troop level in South Vietnam. Photograph, c1971

Background imageGraph Collection: Website source code visualisation

Website source code visualisation, computer artwork. This image was created using WEB2DNA software which is able to transform the source code of a website into an image featuring bands and gaps

Background imageGraph Collection: Interferometer readings

Interferometer readings. This graph shows the results of a test carried out on the isotopes Kr-86 (Krypton 86) and Hg-198 (Mercury 198) by a Fabry-Perot interferometer

Background imageGraph Collection: Ion chromatography system

Ion chromatography system
MODEL RELEASED. Ion chromatography system. Ion chromatography (or ion-exchange chromatography) is the process of ion and polar molecule separation, based on the charge properties of the molecules

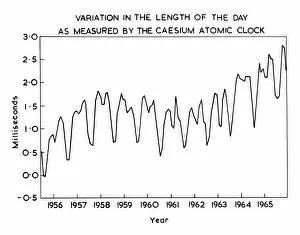
Background imageGraph Collection: Caesium atomic clock readings

Caesium atomic clock readings. A caesium atomic clock contains atoms of vapourised caesium-133 that pass back and forth between magnets at each end of the clock

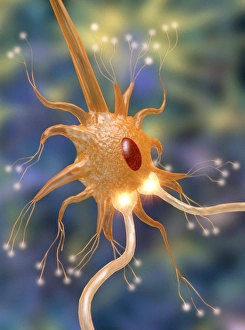
Background imageGraph Collection: Motor neurone nerve cell and synapses

Motor neurone nerve cell and synapses
Motor neurone and synapses. Computer graphic of a motor neurone and synapses (glowing yellow bulges, at lower centre). The cell body is at centre

Background imageGraph Collection: Histogram

Histogram. Screen displaying a histogram. A histogram is a types of graph that displays frequencies

Background imageGraph Collection: Silhouetted statisticians with a computer 3D graph

Silhouetted statisticians with a computer 3D graph
Graph. Two silhouetted statisticians looking at data displayed as a 3-dimensional (3-D) graph on a computer screen

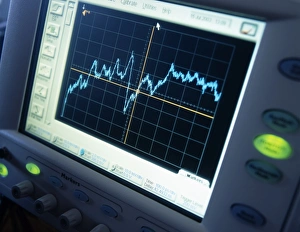
Background imageGraph Collection: Oscilloscope trace

Oscilloscope trace. Screen of an oscilloscope showing a trace of voltage against time. Oscilloscopes are used to display and analyse waveforms of electronic signals

Background imageGraph Collection: Virtual office

Virtual office
MODEL RELEASED. Virtual office. Conceptual computer artwork of a globe and office laptop computers displaying human faces, representing a virtual office


All Professionally Made to Order for Quick Shipping

"Unveiling the Intricacies: A Journey through Graphs" Step into a world where art and science intertwine, as we explore the captivating realm of graphs. From the enchanting Map of Malvern Hills in Worcestershire, England Victorian Engraving, 1840 to the vibrant Colours derived from coal tar (colour litho), each graph tells a unique story. Travel back in time with us as we unravel history's secrets through the Map of the City of Durham, England Victorian Engraving, 1840. Witness how this intricate illustration captures an era long gone yet preserved within its lines. Delve into celestial wonders as you gaze upon the Diagram showing the spectral class and luminosity of stars. Marvel at their brilliance and understand how these cosmic entities are classified based on their radiant characteristics. Under The Arch lies a hidden world waiting to be discovered. Explore H-He-Hg emission spectra C017 / 7260 and uncover its mysteries alongside Kapitsa and Androv, Russian physicists who paved new paths in scientific exploration. Let us not forget those brilliant minds that shaped our understanding of graphs. Leonhard Euler, Swiss mathematician extraordinaire whose contributions revolutionized mathematics forever. His legacy lives on within every line etched onto paper or screen. Witness modern marvels unfold before your eyes with Air traffic visualization - a testament to human ingenuity ensuring safe skies for all travelers. Immerse yourself in Internet blog map showcasing interconnectedness like never before – bridging gaps between people across continents. Journey further through time with maps depicting Coventry in Warwickshire, England Victorian Engraving, 1840 and Exeter in Devon, England Victorian Engraving, 1840 – glimpses into bygone eras frozen within ink strokes. In this vast universe of knowledge encapsulated within graphs' allure lies endless possibilities waiting to be explored. So join us on this extraordinary expedition, where art meets science and history intertwines with innovation.