
Wavelength Collection
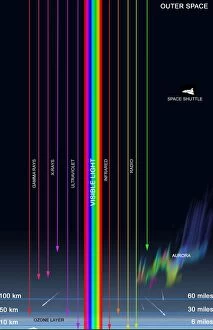
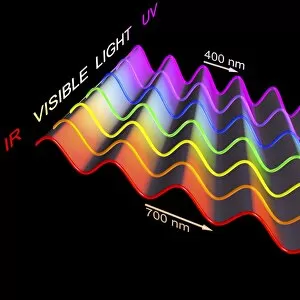
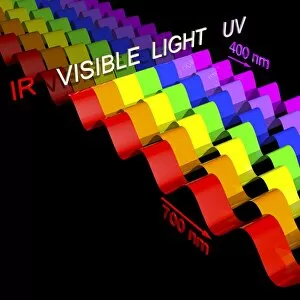
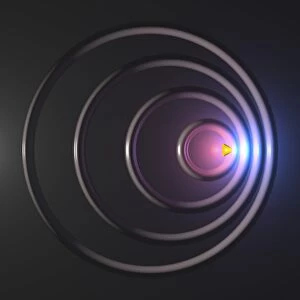
"Wavelength: Unveiling the Vibrant Spectrum of Light" Step into the fascinating world of wavelengths, where science and beauty intertwine


All Professionally Made to Order for Quick Shipping
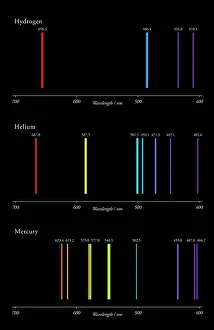
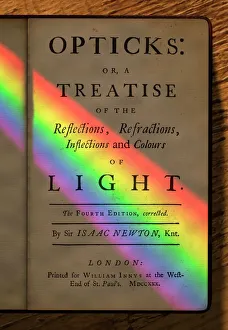
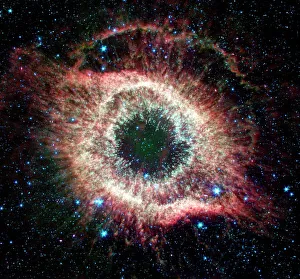
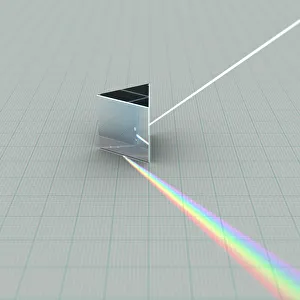
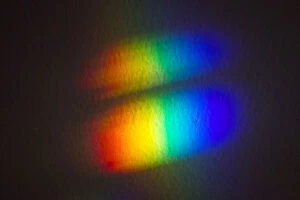
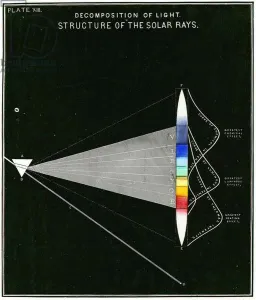
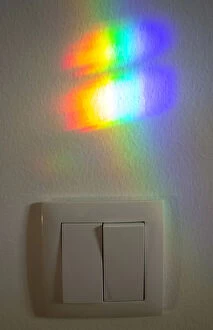
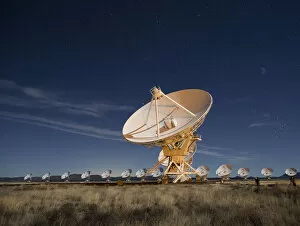
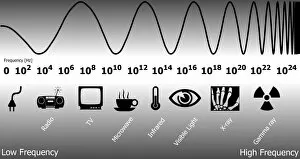
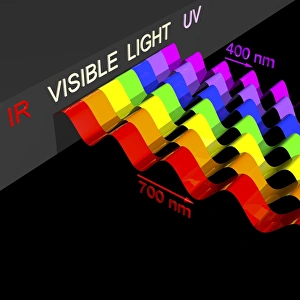
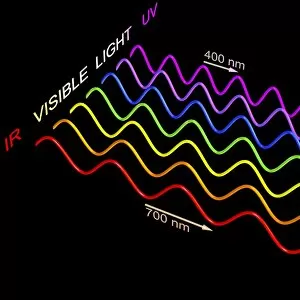
"Wavelength: Unveiling the Vibrant Spectrum of Light" Step into the fascinating world of wavelengths, where science and beauty intertwine. From H-He-Hg emission spectra C017 to Newton's Opticks with its mesmerizing color spectrum, we embark on a journey through the wonders of light. Gaze upon the captivating Helix nebula, revealed in all its glory through an infrared Spitzer image. Witness how a simple glass prism can refract light into a breathtaking display of colors, as seen in Picture No. 12479817. Delve deeper into the secrets held within light itself with a diagram showcasing the decomposition of solar rays. Marvel at Picture No. 12479816, capturing photographers captivated by Karl G. Jansky's Very Large Array (VLA) at the National Radio Astronomy Observatory. As you explore further, encounter man-made marvels like radio waves that connect us across vast distances - symbolized by an individual intently listening to his radio. Return to nature's grandeur as you witness once again Karl G. Jansky's VLA dishes towering against the sky at National Radio Astronomy Observatory. These colossal structures enable us to unravel mysteries hidden within celestial bodies. In this symphony of scientific exploration and artistic appreciation, wavelength becomes more than just a measurement; it becomes our window into understanding and appreciating the universe around us – both seen and unseen.