
Line Graph Collection
"Unveiling the Wealth of Data: Exploring Line Graphs in Various Contexts" In a captivating black and white illustration


All Professionally Made to Order for Quick Shipping
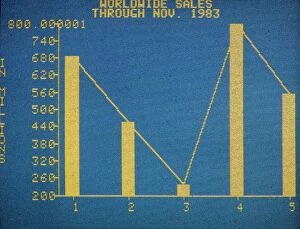
"Unveiling the Wealth of Data: Exploring Line Graphs in Various Contexts" In a captivating black and white illustration, an EEG recording reveals the intricate electrical activity within a brain during a petit mal seizure. This thought-provoking image reminds us of the power of line graphs to depict complex phenomena. The stock market, with its ever-changing performance, wealth, and finance dynamics, finds representation in a man standing confidently in front of a graph. The lines on this visual representation symbolize growth and fluctuations that can make or break fortunes. Amidst this financial realm, an unexpected presence emerges—a grizzly bear. A reminder that even amidst growth, there are risks lurking around every corner. Just as stock prices change over time like waves on an Apple II computer screen back in 1983 when technology was taking leaps forward. Bar graphs also play their part in showcasing data trends; one such example is VisiTrend graphics software portraying monthly sales for companies displayed on an Apple II computer from that same era. These visuals provide insights into business performance at a glance. Diving into history's archives brings forth intriguing line graphs depicting significant events like Robert Goddard's rocket launch test results from June 24th, 1941. These lines charted his groundbreaking achievements and propelled humanity towards space exploration. Even during times of economic turmoil like the Great Depression of the 1930s depicted through cartoons illustrating movements within the stock market—line graphs serve as vital tools for understanding patterns and predicting future outcomes. Shifting our focus to demographics reveals another facet where line graphs shine—the composition of foreign-born populations in the United States between 1850-1940. With declining immigration from Ireland but fairly constant numbers from Britain, Canada, Germany alongside rising figures from other European countries—these lines paint portraits of changing societal landscapes over time.