
Ir Collection (page 5)
"Exploring the Mysteries of 'ir': From the Hubble Ultra Deep Field 2012 to the Richat Structure" Witnessing the wonders of our universe


All Professionally Made to Order for Quick Shipping
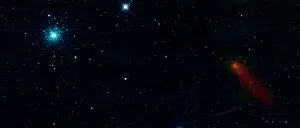
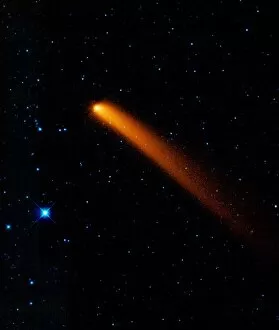
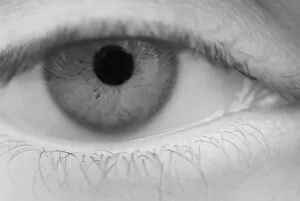
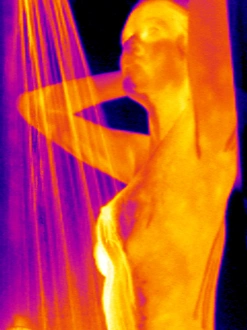
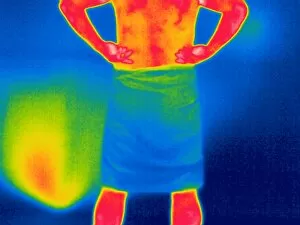
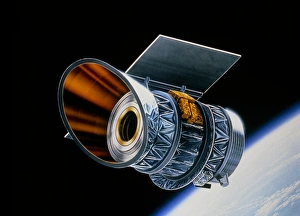
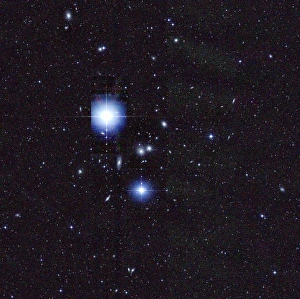
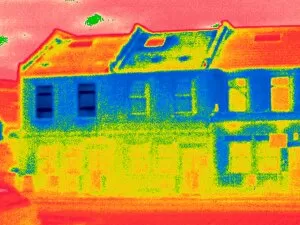
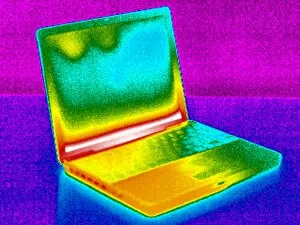
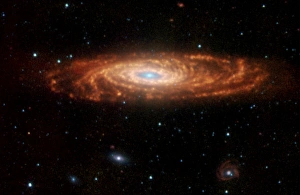
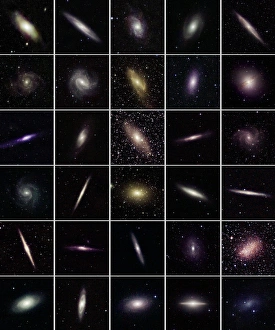
"Exploring the Mysteries of 'ir': From the Hubble Ultra Deep Field 2012 to the Richat Structure" Witnessing the wonders of our universe, the Hubble Ultra Deep Field 2012 captures ethereal beauty in every pixel, revealing distant galaxies bathed in 'ir' light. Behold the Orion nebula, a celestial masterpiece painted with vibrant hues of 'ir', showcasing stellar nurseries and newborn stars amidst swirling cosmic dust. Jupiter and its enigmatic moon Io dance together in this mesmerizing New Horizons image, where 'ir' unveils hidden details of their intricate relationship. The Crab nebula comes alive through a captivating composite image, blending visible and 'ir' wavelengths to expose remnants of an ancient supernova explosion. Prepare to be awestruck by M81, a spiral galaxy that reveals its true splendor when viewed through an 'ir' lens - unveiling delicate arms adorned with countless stars. As shadows cast upon Jupiter's surface come into focus, we marvel at this stunning composition captured by astronomers using advanced infrared technology. Delve into the depths of space as Spitzer's infrared eyes capture the Helix nebula's intricate structures - unveiling layers upon layers of interstellar gas and dust. Once again, M81 takes center stage as we explore its mesmerizing beauty through a composite image that merges visible light with tantalizing hints of infrared radiance. A thermogram captures more than just warmth; it paints a vivid picture as a teapot pours forth hot liquid - each temperature gradient telling its own story through subtle shades of 'ir'. Gaze upon Earth from above as satellite imagery unveils breathtaking patterns etched across Syria's vast desert landscape - an abstract artwork created by nature itself in invisible wavelengths.