
Graphs Collection
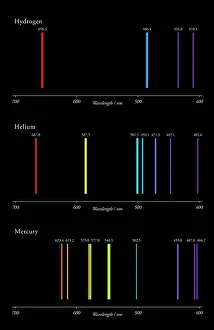
"Unveiling the Hidden Patterns: Exploring the World of Graphs" H-He-Hg emission spectra C017 / 7260


All Professionally Made to Order for Quick Shipping
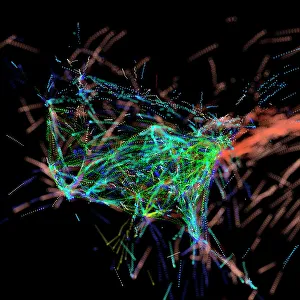
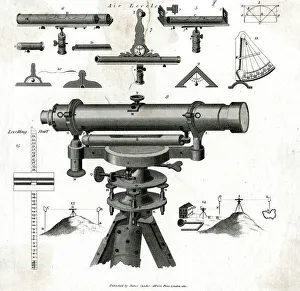
"Unveiling the Hidden Patterns: Exploring the World of Graphs" H-He-Hg emission spectra C017 / 7260: Delving into the colorful world of atomic emissions and unraveling their mysteries through graphs. Air traffic visualization: Navigating the skies with precision, graphs provide a visual representation of air traffic patterns for efficient travel management. Agricultural and manufacturing output and wealth and debts of the United States (colored engraving): Unearthing economic insights from historical data, graphs shed light on America's growth, prosperity, and financial challenges. SURVEYING LEVELS: From mapping terrains to constructing buildings, graphs play a vital role in surveying by accurately representing elevation levels for precise measurements. DNA analysis: Unlocking our genetic code through intricate graphical representations allows scientists to decode life's secrets and advance medical research. Area and population of the United States (colored engraving): Visualizing geographical expansion alongside population growth provides valuable insights into America's development over time. Physik Atlas, 1848 (color litho): Journey back in time as we explore scientific discoveries depicted in beautifully illustrated graphs that shaped our understanding of physics. Comparison of national debt, money circulation, wealth, commerce, and size of military forces worldwide (colored engraving): Comparative graphs offer a global perspective on economic indicators while highlighting disparities among nations throughout history. Wavelength: Diving into the realm where science meets artistry – wavelengths captured visually through stunning graphical representations reveal nature's vibrant spectrum like never before. Munitions output during 1915 and 1916 - WW1: Examining war efforts graphically unveils production trends during critical years when nations mobilized resources to support their troops on battlefields worldwide. Global economy: A complex web interconnecting nations' economies comes alive through comprehensive graphical representations, providing insights into the intricate dynamics of our globalized world.