Fraud Blocker Skip to main content

Climatic Collection

"Climatic Wonders

Background imageClimatic Collection: Distributions of plants at various altitudes

Distributions of plants at various altitudes
Coloured engraving of Alexander Humboldt illustration. Tableaux de la Nature, 1865. Date: 1865

Background imageClimatic Collection: Observatory on the summit of Ben Nevis, Scotland

Observatory on the summit of Ben Nevis, Scotland
Observatory on the summit of Ben Nevis, Fort William, Scotland Date: 1908

Background imageClimatic Collection: A Tip for the Holidays

A Tip for the Holidays
A new combination game to suit all seasons. Please note: Credit must appear as Courtesy of the Estate of Mrs J.C.Robinson/Pollinger Ltd/ILN/Mary Evans

Background imageClimatic Collection: Life in the Klondyke Gold Fields, the Dark Side of the Picture, the Camp Doctors Daily Work (litho)

Life in the Klondyke Gold Fields, the Dark Side of the Picture, the Camp Doctors Daily Work (litho)
1063681 Life in the Klondyke Gold Fields, the Dark Side of the Picture, the Camp Doctors Daily Work (litho) by English School

Background imageClimatic Collection: Mean annual rainfall, with limits of snowfall, Prevailing winds, Climatic diseases (colour litho)

Mean annual rainfall, with limits of snowfall, Prevailing winds, Climatic diseases (colour litho)
3648581 Mean annual rainfall, with limits of snowfall, Prevailing winds, Climatic diseases (colour litho) by English School, (20th century); Private Collection; (add.info.: Mean annual rainfall)

Background imageClimatic Collection: Convair YB-58A-1-CF Hustler 55-670

Convair YB-58A-1-CF Hustler 55-670 (msn 11) of the 6592nd Test Squadron, Carswell AFB, TX, with markings for Operation Deep Freeze, the climatic testing of the B-58 carried out at Eglin AFB

Background imageClimatic Collection: German students on a summer camping trip - Kirchen

German students on a summer camping trip - Kirchen, Germany on the River Sieg. Kirchen is a town (and climatic spa) in the district of Altenkirchen in the north of Rhineland-Palatinate

Background imageClimatic Collection: Corner Of The Saint Michel Bridge During The Hurricane Which Hit Paris March 8, 1868

Corner Of The Saint Michel Bridge During The Hurricane Which Hit Paris March 8, 1868. From L univers Illustre Published In Paris In 1868

Background imageClimatic Collection: Isotherm and climate zones chart 1889

Isotherm and climate zones chart 1889
Indiana Educational Series The Complete Geography - Indianapolis 1889

Background imageClimatic Collection: January, Pieter van der Borcht (I), 1545 - 1608

January, Pieter van der Borcht (I), 1545 - 1608

Background imageClimatic Collection: June, Pieter van der Borcht (I), 1545 - 1608

June, Pieter van der Borcht (I), 1545 - 1608

Background imageClimatic Collection: July, Pieter van der Borcht (I), 1545 - 1608

July, Pieter van der Borcht (I), 1545 - 1608

Background imageClimatic Collection: December, print maker: Pieter van der Borcht I, 1545 - 1608

December, print maker: Pieter van der Borcht I, 1545 - 1608

Background imageClimatic Collection: April. Julius Goltzius, Gillis Mostaert (I), Claes Jansz. Visscher (II), c. 1560 - 1595

April. Julius Goltzius, Gillis Mostaert (I), Claes Jansz. Visscher (II), c. 1560 - 1595

Background imageClimatic Collection: January, Julius Goltzius, Claes Jansz. Visscher (II), c. 1560 - 1595

January, Julius Goltzius, Claes Jansz. Visscher (II), c. 1560 - 1595

Background imageClimatic Collection: June, Julius Goltzius, Gillis Mostaert (I), Claes Jansz. Visscher (II), c. 1560 - 1595

June, Julius Goltzius, Gillis Mostaert (I), Claes Jansz. Visscher (II), c. 1560 - 1595

Background imageClimatic Collection: November, Julius Goltzius, Gillis Mostaert (I), Claes Jansz

November, Julius Goltzius, Gillis Mostaert (I), Claes Jansz. Visscher (II), c. 1560 - 1595

Background imageClimatic Collection: Augustus, Julius Goltzius, Gillis Mostaert I, Claes Jansz. Visscher II, c. 1560 - 1595

Augustus, Julius Goltzius, Gillis Mostaert I, Claes Jansz. Visscher II, c. 1560 - 1595

Background imageClimatic Collection: May, Julius Goltzius, Gillis Mostaert (I), Hans van Luyck, c. 1560 - 1595

May, Julius Goltzius, Gillis Mostaert (I), Hans van Luyck, c. 1560 - 1595

Background imageClimatic Collection: July, Julius Goltzius, Gillis Mostaert (I), Hans van Luyck, c. 1560 - 1595

July, Julius Goltzius, Gillis Mostaert (I), Hans van Luyck, c. 1560 - 1595

Background imageClimatic Collection: October, Julius Goltzius, Gillis Mostaert (I), Hans van Luyck, c. 1560 - 1595

October, Julius Goltzius, Gillis Mostaert (I), Hans van Luyck, c. 1560 - 1595

Background imageClimatic Collection: December, Julius Goltzius, Gillis Mostaert (I), Hans van Luyck, c. 1560 - 1595

December, Julius Goltzius, Gillis Mostaert (I), Hans van Luyck, c. 1560 - 1595

Background imageClimatic Collection: Tufa landscape near Goereme, Cappadocia, Anatolia, Turkey, Western Asia

Tufa landscape near Goereme, Cappadocia, Anatolia, Turkey, Western Asia

Background imageClimatic Collection: Armstrong Whitworth Seaslug ship-to

Armstrong Whitworth Seaslug ship-to
A technician inspects an Armstrong Whitworth Seaslug ship-to-air missile after it has undergone testing at arctic temperatures in the companys climatic chamber. November 1959. Date: 1959

Background imageClimatic Collection: Jet streams, artwork

Jet streams, artwork
Jet streams. Computer artwork showing the paths of the jet streams around the globe. Jet streams are fast flowing high-altitude narrow air currents that circle the Earth

Background imageClimatic Collection: Sunset as seen from Little Deer Isle, Maine. Penobscot Bay

Sunset as seen from Little Deer Isle, Maine. Penobscot Bay

Background imageClimatic Collection: Martian dust devils

Martian dust devils, artwork. Mars is a rocky desert world with no surface water. Wind erosion creates sandy deserts, and thermal heating creates localized vortices that can spin dust up into

Background imageClimatic Collection: Earths 3-D cloud cover

Earths 3-D cloud cover. Coloured composite image of the Earth, showing surface temperature (various colours) and three-dimensional (3-D) cloud cover (white)

Background imageClimatic Collection: Global drought, conceptual image

Global drought, conceptual image. Map of the Earth representing drought due to climate change

Background imageClimatic Collection: Atlantic storms, QuikSCAT radar image

Atlantic storms, QuikSCAT radar image
Atlantic storms, radar image. This map, centred on the Atlantic, shows wind speeds measured by radar from the QuikSCAT satellite

Background imageClimatic Collection: Snowball Earth

Snowball Earth. Computer artwork of the Earth frozen in snow and ice some 590 million years ago. The continents are in different positions due to tectonic plate movements

Background imageClimatic Collection: Global temperature anomalies 2006-2010

Global temperature anomalies 2006-2010
Global temperature anomalies. Illustration showing five-year average global temperature anomalies from 2006 to 2010. The scale runs from dark red, indicating areas warmer than average, to dark blue


All Professionally Made to Order for Quick Shipping

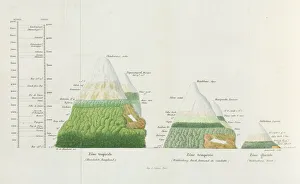
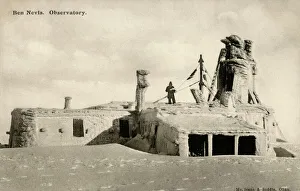
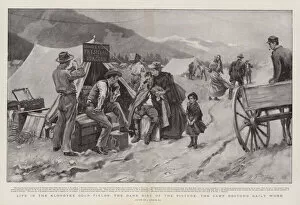
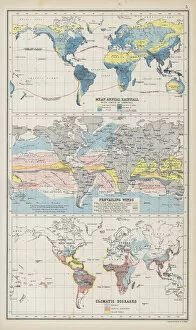
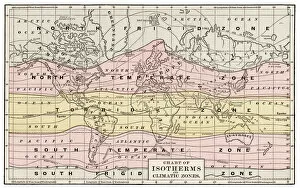
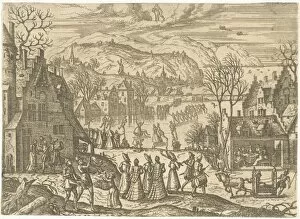
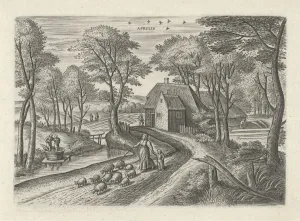
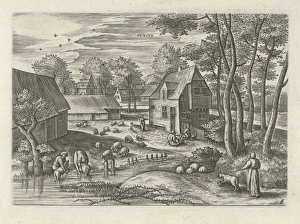
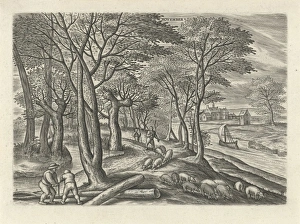
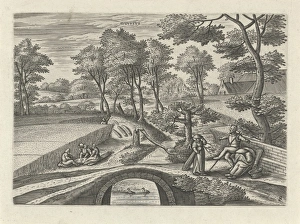
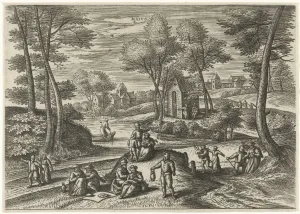
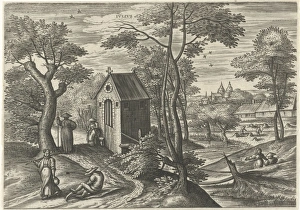
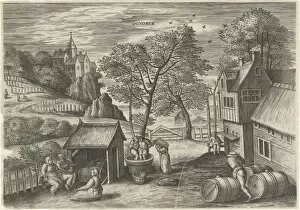
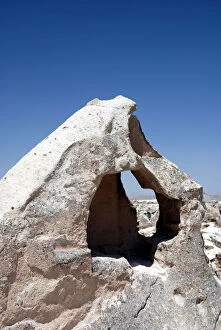
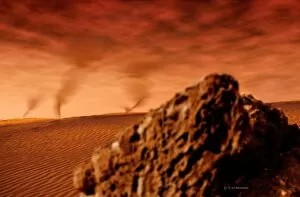
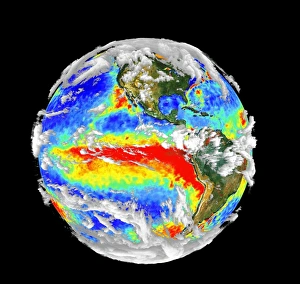
"Climatic Wonders: From Plant Distributions to Extreme Weather" Distributions of plants at various altitudes unveil the fascinating adaptation strategies in response to changing climates. The observatory on the summit of Ben Nevis, Scotland offers an unparalleled vantage point to study climatic patterns and their impact on the surrounding landscape. A tip for the holidays: Explore destinations with diverse climates, from lush rainforests to arid deserts, and witness nature's incredible resilience. Life in the Klondyke Gold Fields reveals both the allure and challenges posed by extreme climatic conditions, where camp doctors work tirelessly against harsh elements. Mean annual rainfall and prevailing winds shape landscapes worldwide while also influencing climatic diseases that emerge within specific regions. The Convair YB-58A-1-CF Hustler 55-670 showcases technological advancements aimed at conquering atmospheric challenges during flight operations. German students embark on a summer camping trip amidst varying climate zones, experiencing firsthand how different environments shape human experiences. Isotherm and climate zones chart from 1889 provides historical insights into our understanding of global weather patterns and regional variations across continents. Cherry trees blossoming in canola fields signify spring's arrival in Baden-Wuerttemberg, Schwarzwald, Germany – a testament to nature's cyclical response to changing climates. Corner Of The Saint Michel Bridge during the hurricane which hit Paris in March 1868 depicts how extreme weather events can disrupt urban life but also inspire resilience efforts for future preparedness. January painting by Pieter van der Borcht (I), 1545 - 1608 captures winter's icy grip as it shapes landscapes under cold temperatures across different regions. June painting by Pieter van der Borcht (I), 1545 - 1608 illustrates vibrant scenes of summer, highlighting the diverse climatic experiences across various parts of the world.